Strive Insight work with all types of data, Qualitative, Quantitative, Social Media, and Big Data. They covers all research techniques from traditional approaches to the latest tools. Clients engage with them in a variety of ways – from resighting existing data to large-scale primary research programmes.
Every project they design is bespoke to the clients and their needs, so there is no set solution. They have extensive experience with all socio-economic groups, from mass market to niche audiences and we deal with businesses of all sizes – SoHo, SMEs and Multi-National Corporations.
Many of their projects are global in scope and our clients are spread across the UK, Europe, US, Asia and Australasia.
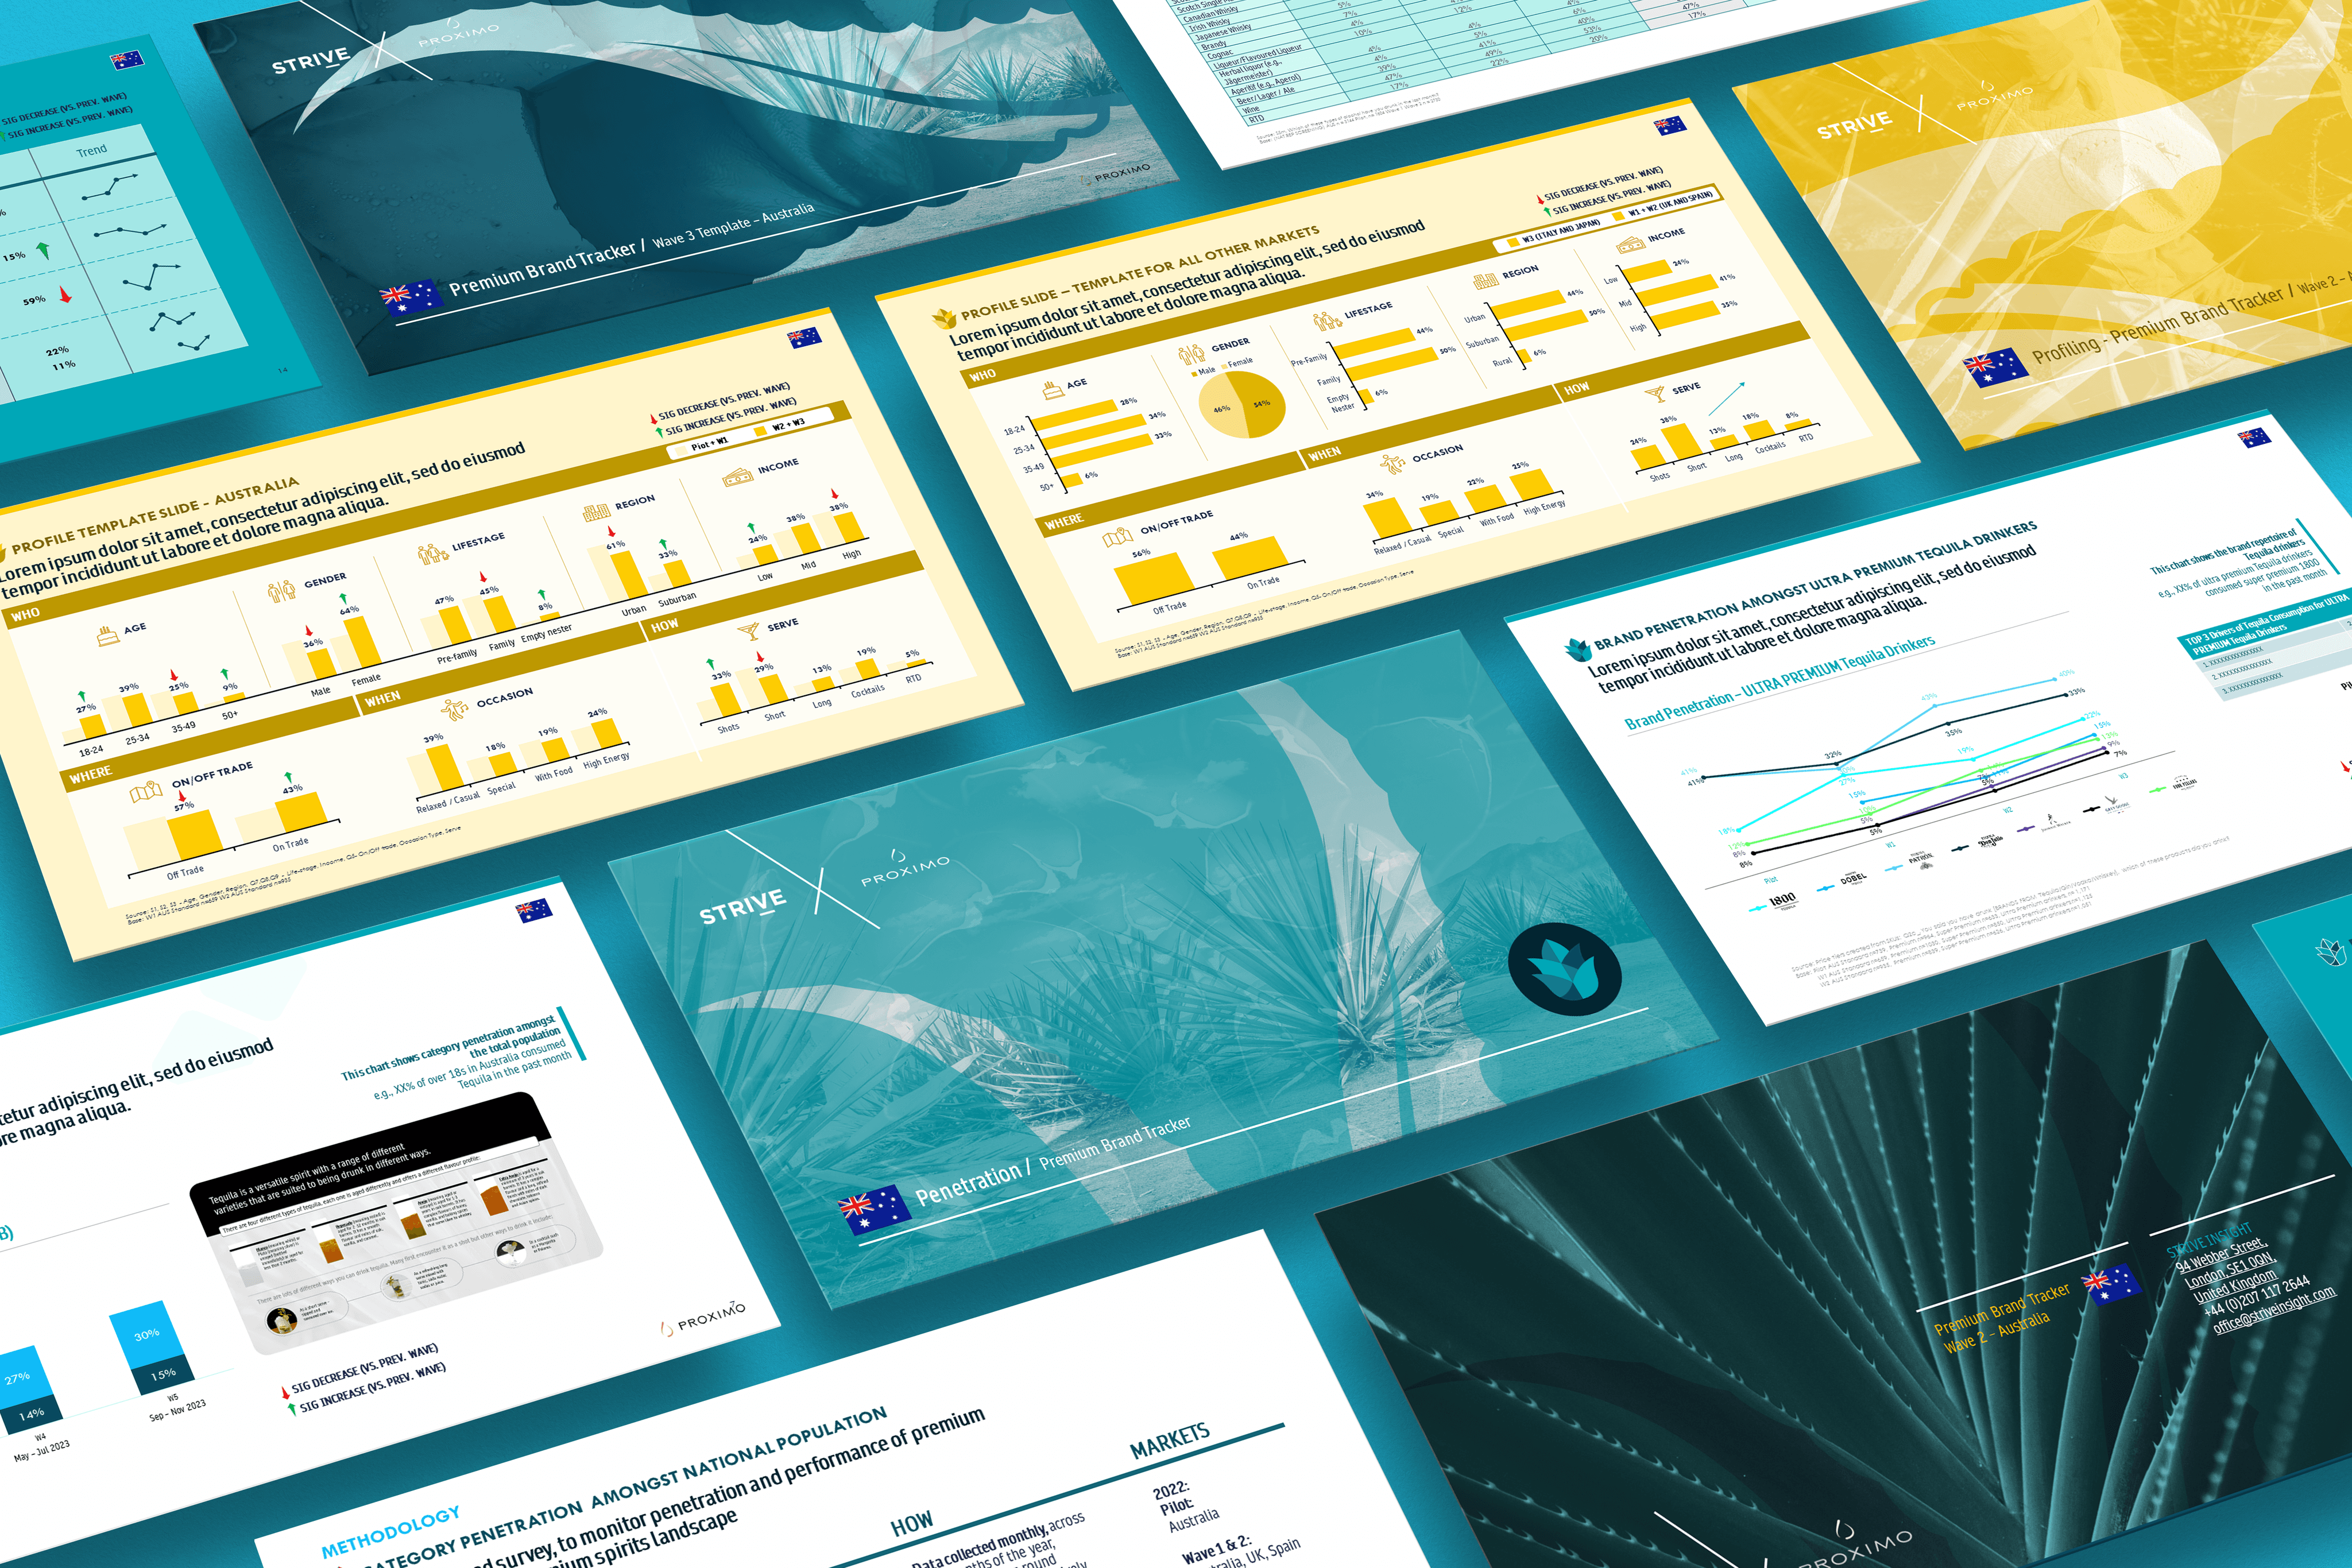
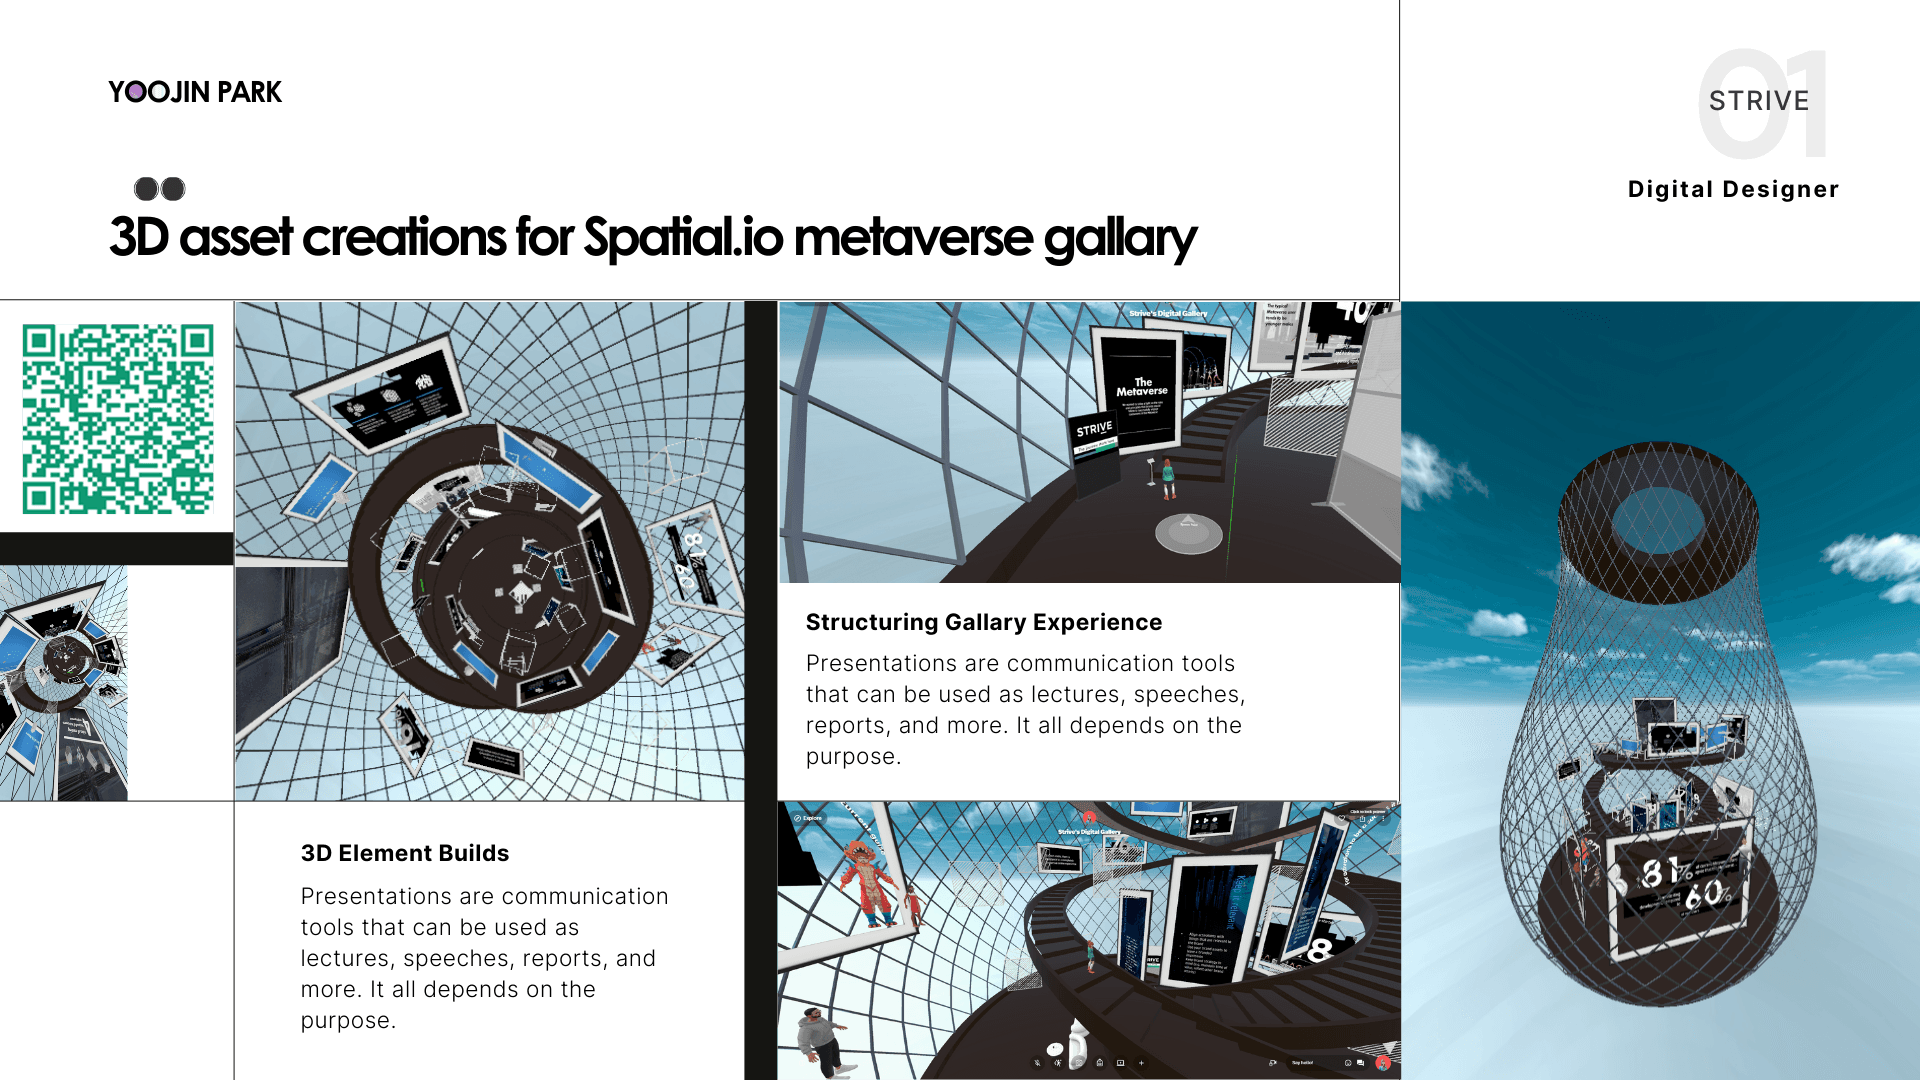
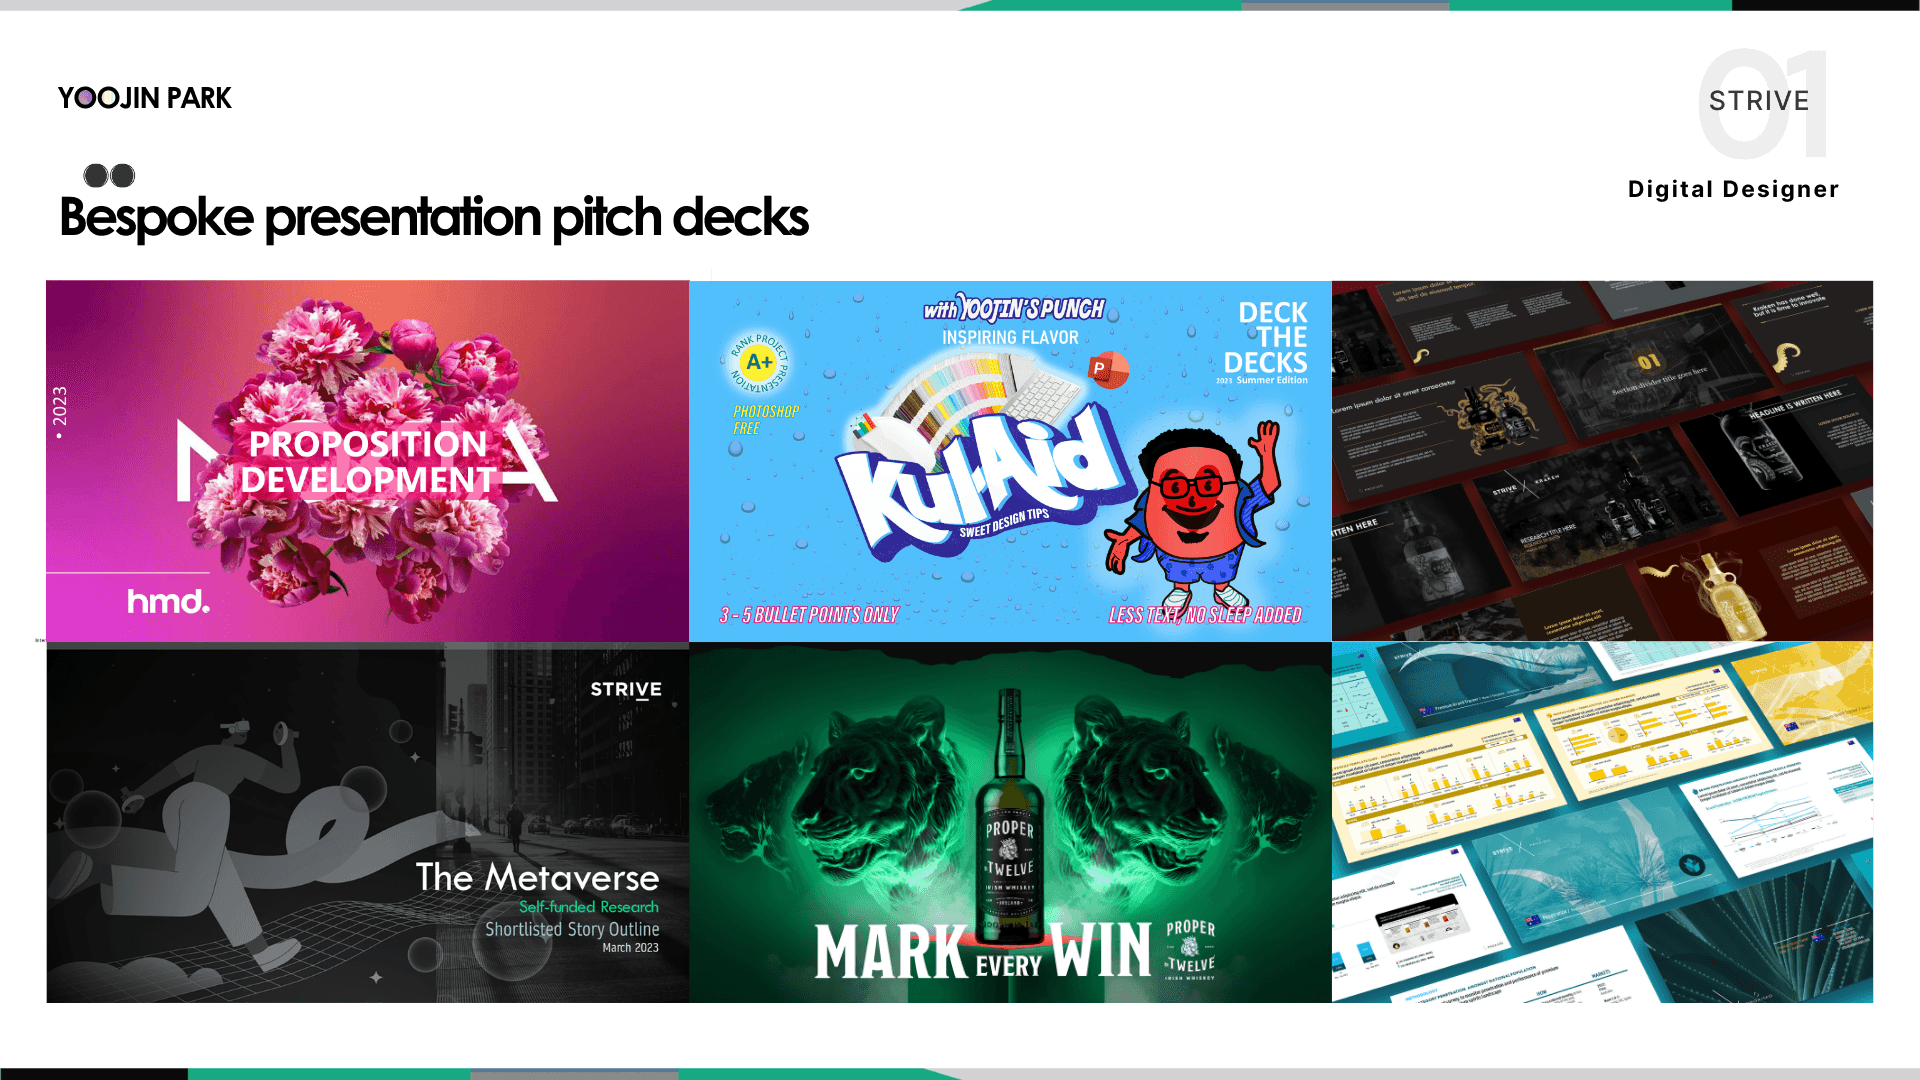
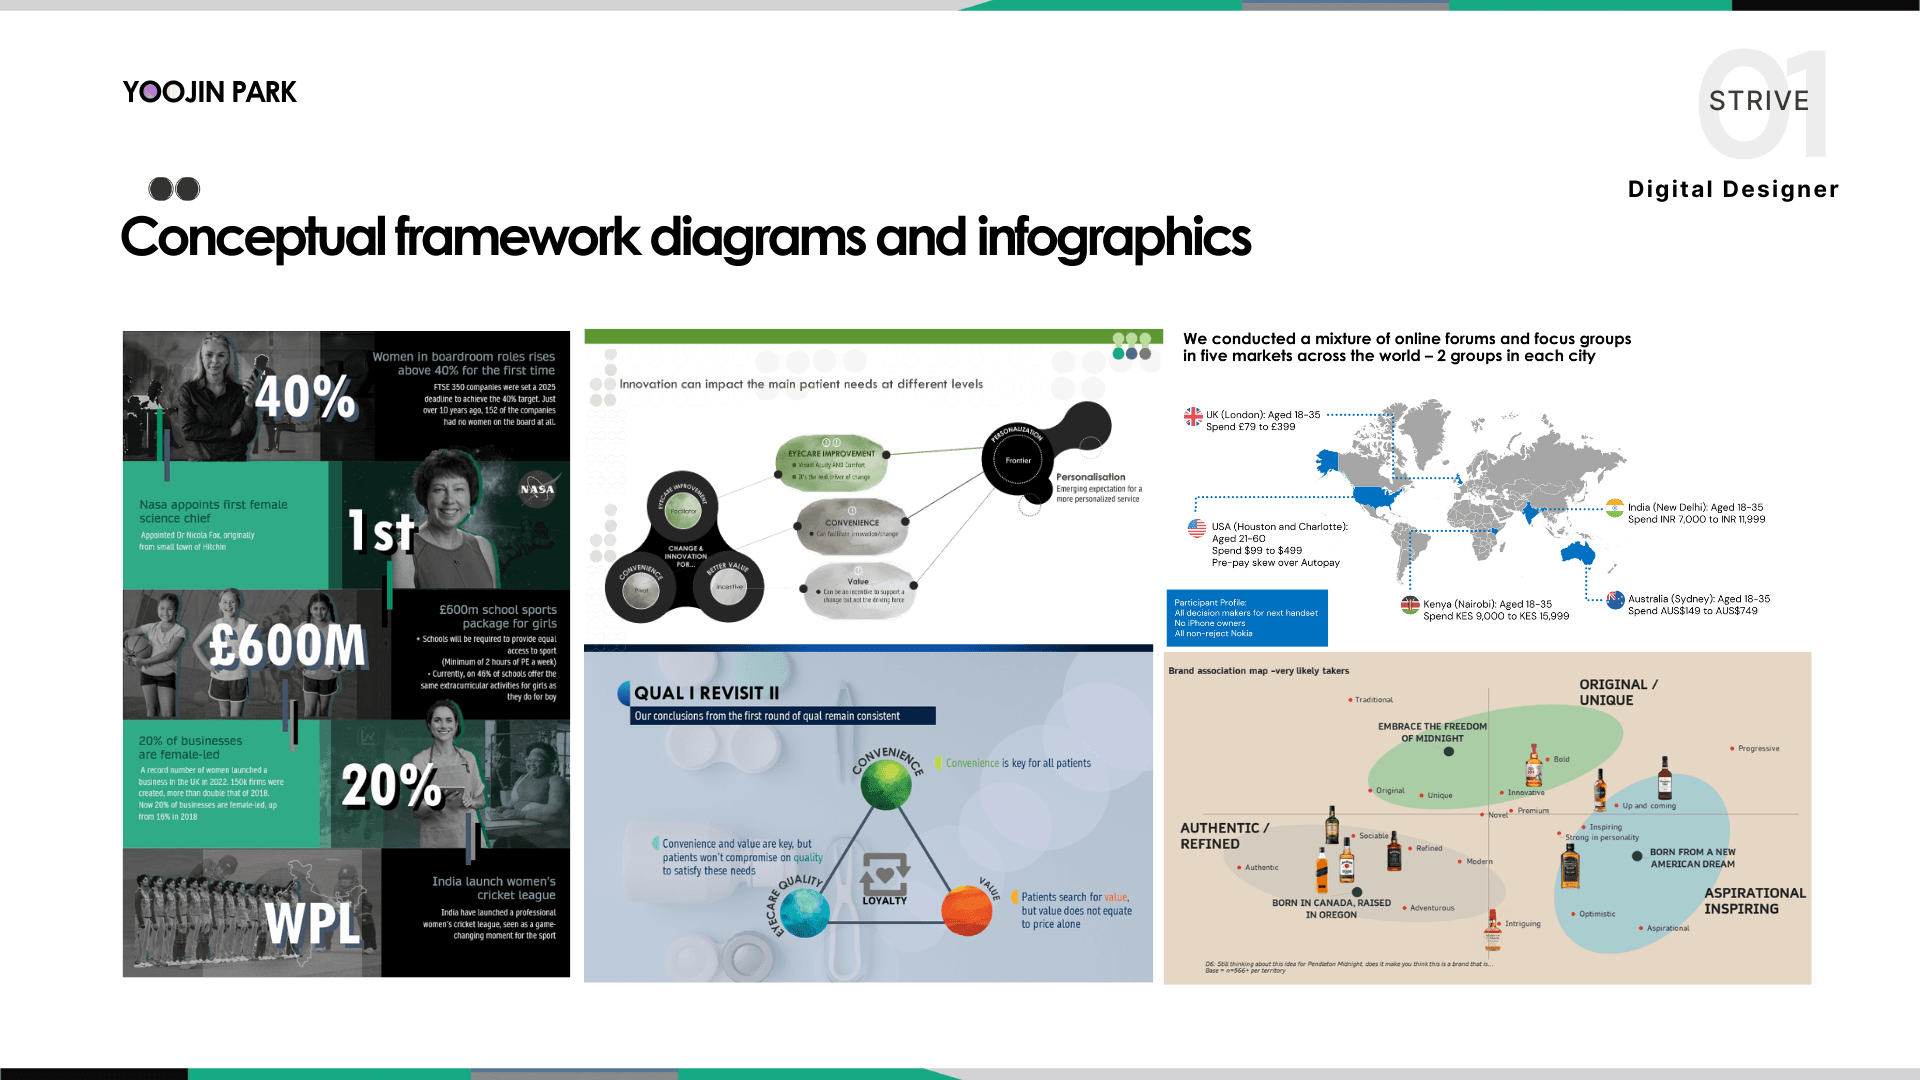
As a digital designer / presentation designer, I had the pleasure of working on numerous projects across a wide range of industries. Among my key responsibilities were visualizing data in a clear and impactful way, designing conceptual framework diagrams, creating static and animated infographics, and developing new imagery for various content types.
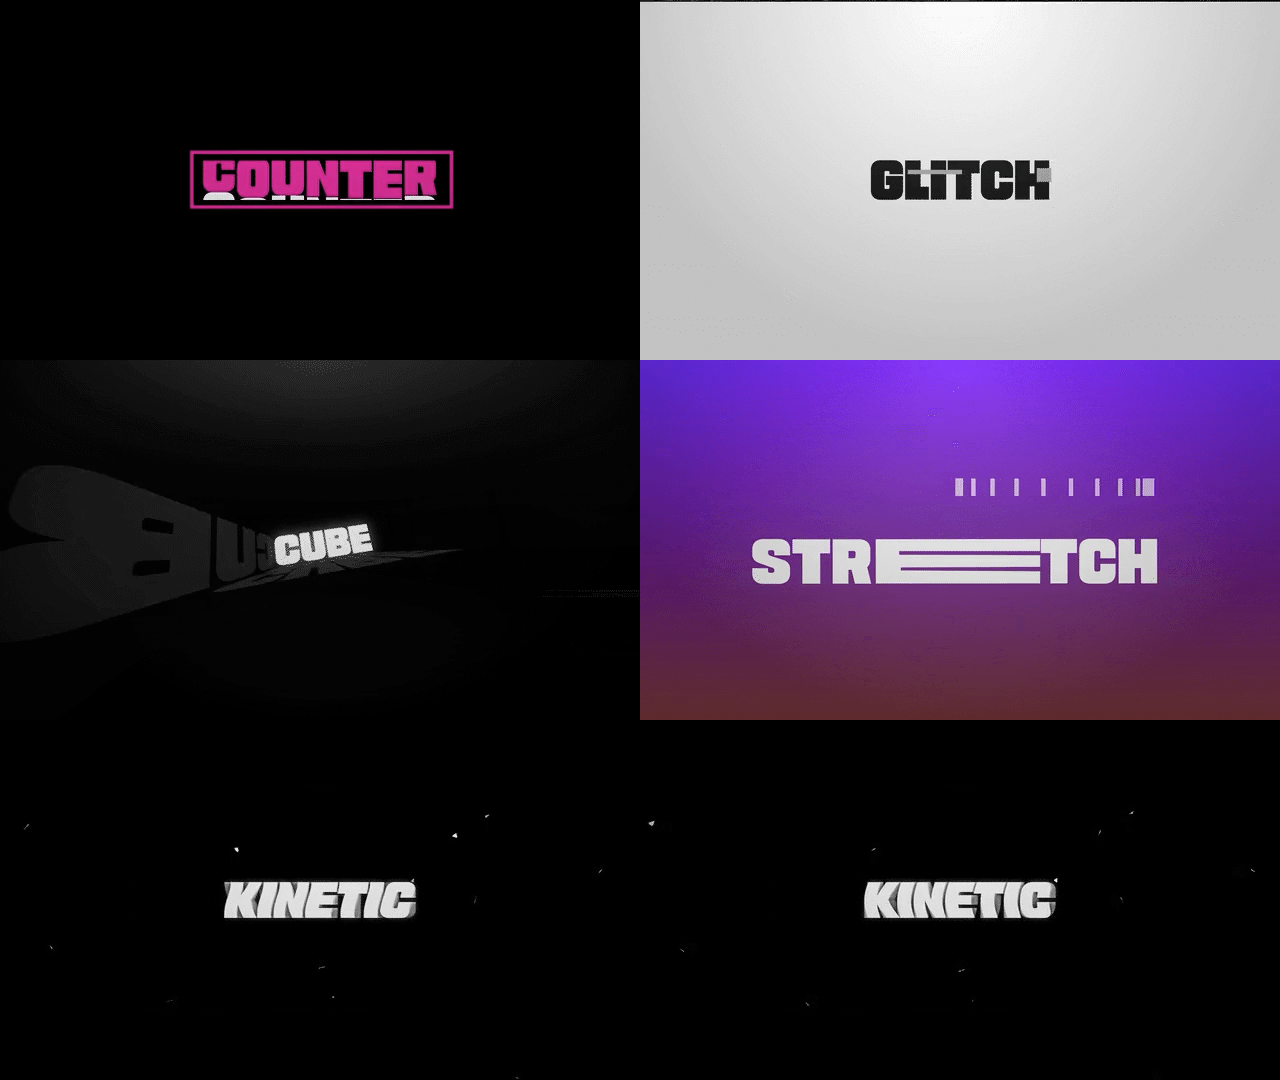
🎬 Motion Graphics Design: Bringing Static Content to Life
One of my standout skills was motion graphics design. By leveraging advanced software tools such as Adobe After Effects and Cinema 4D, I was able to create stunning visuals that brought static content to life. Motion graphics were ideal for showcasing complex processes and data sets, as they could be used to demonstrate movement and illustrate cause-and-effect relationships. Whether it was a product demo, explainer video, or a social media campaign, motion graphics made a huge impact on the way content was perceived by audiences.
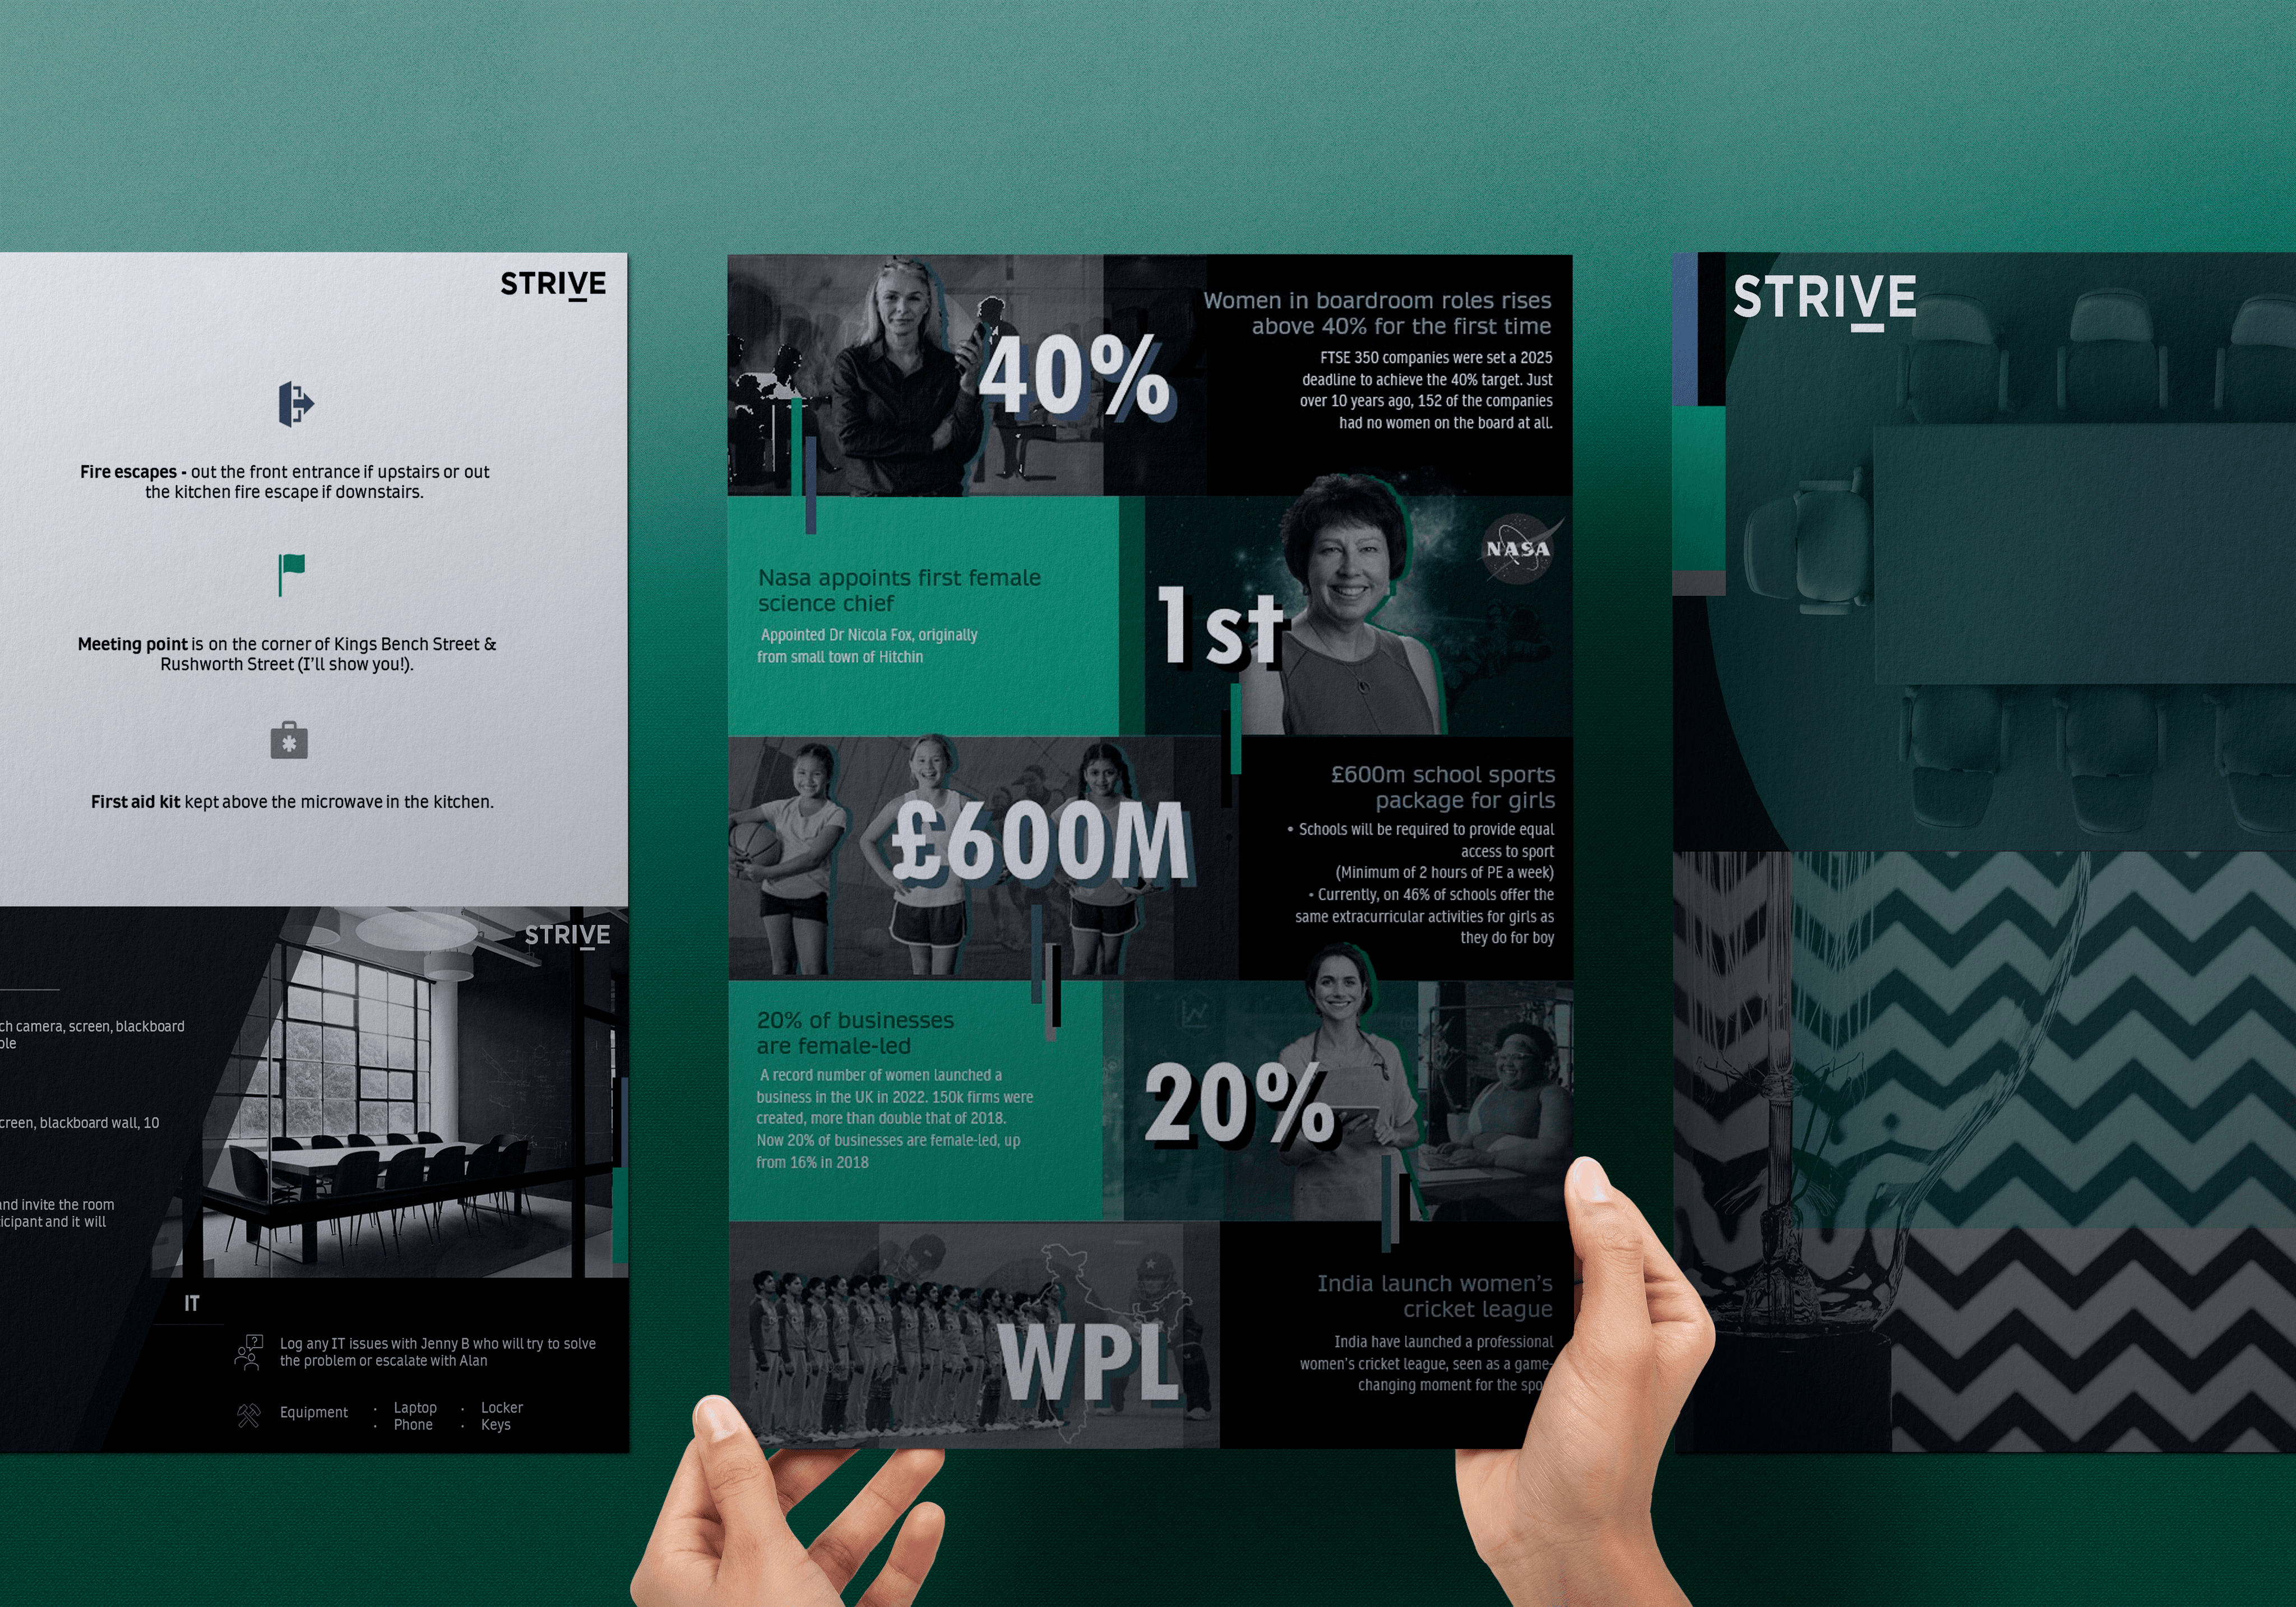
📊 Data Visualization: Making Sense of Complex Data Sets
Another area where I excelled was data visualization. In today's information age, there was an overwhelming amount of data to contend with, and it could be difficult to make sense of it all. This is where data visualization came in - by using graphics and other visual elements to represent data in a clear and concise manner, it became much easier to understand complex concepts and trends. As a digital designer, I was adept at creating custom data visualizations that were tailored to the specific needs of each project. By using a combination of typography, color, and graphic elements, I was able to create visuals that were both informative and visually engaging.
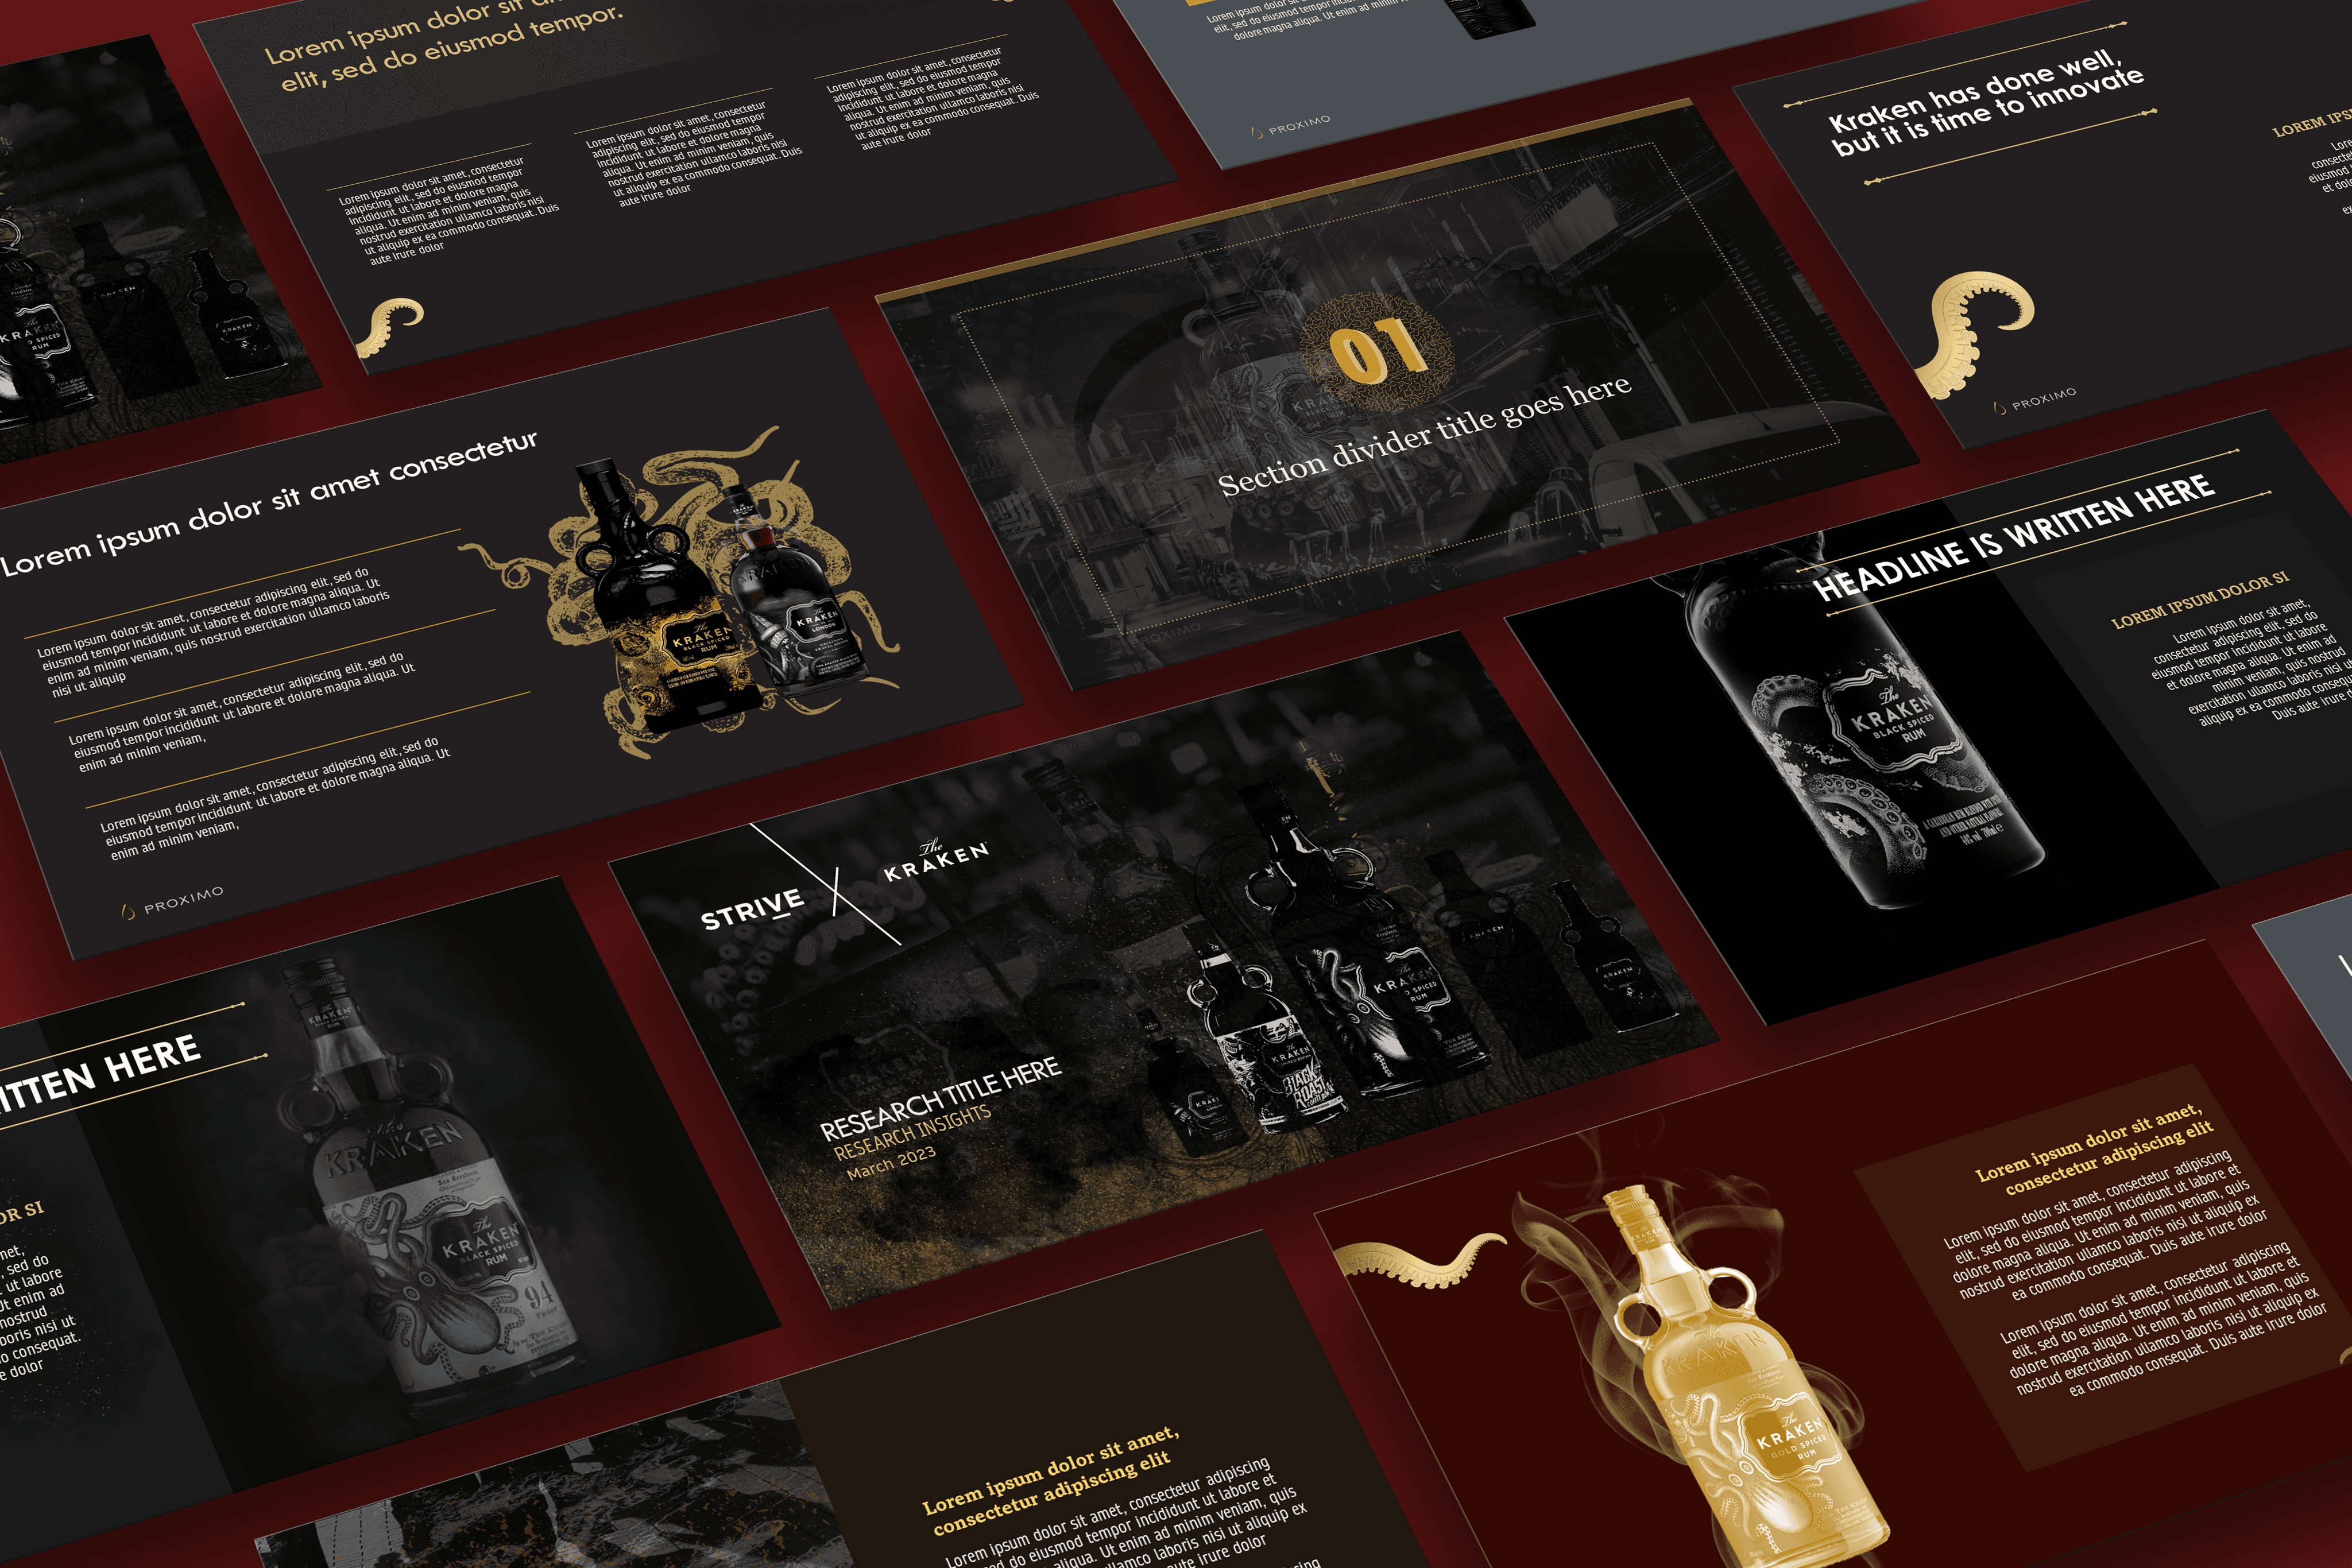
🌐 Conceptual Framework Design: Delivering Complex Ideas
In addition to motion graphics and data visualization, I was also responsible for designing conceptual framework diagrams. These diagrams were critical for illustrating key concepts and ideas in a way that was both informative and visually appealing. By using a combination of graphic elements, typography, and color, I was able to create framework diagrams that were easy to understand and could be used to communicate complex ideas to a variety of audiences.
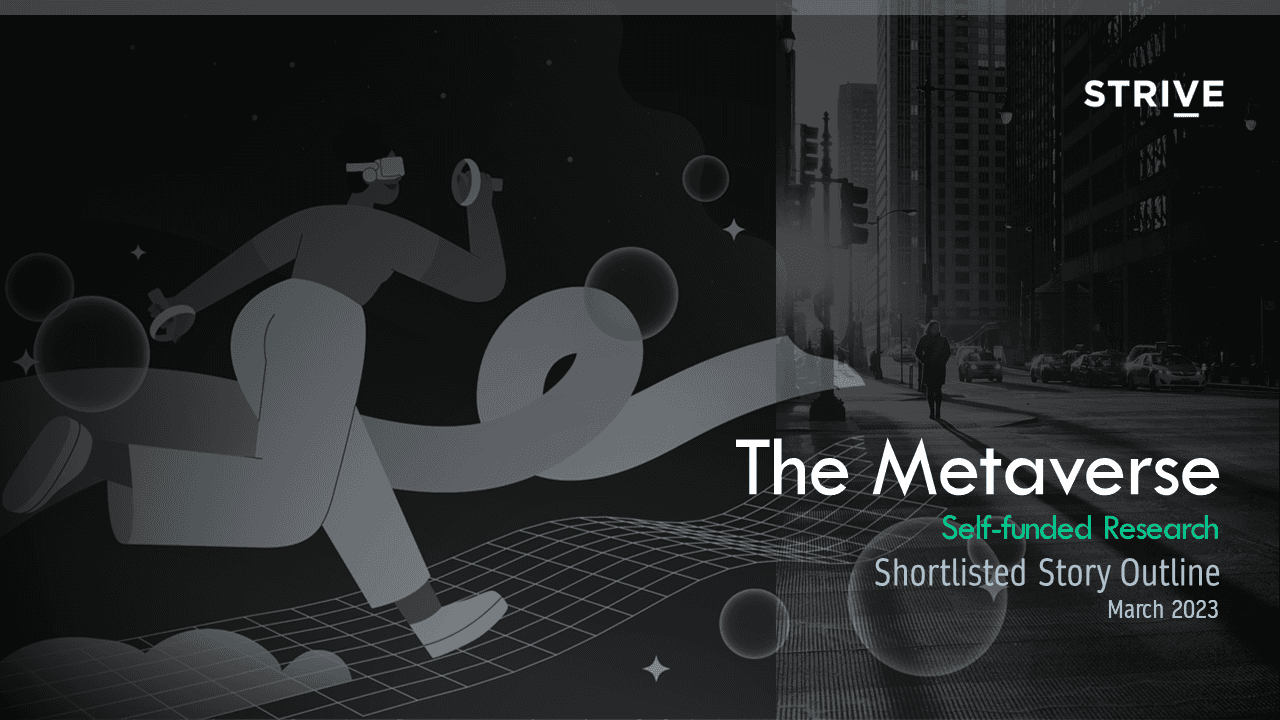
🖼️ Imagery Development: Creating a Cohesive Brand Identity
Finally, I was responsible for developing new imagery for various content types. This included everything from report design and layout to blog content and white papers. By working closely with the content team, I was able to create custom graphics that were tailored to the specific needs of each project. This ensured that our content was visually consistent across all platforms and helped to establish a cohesive brand identity.
Overall, as a digital designer, I brought a diverse skill set to the table, including motion graphics design, data visualization, and conceptual framework design. By leveraging these skills, I was able to create visually engaging content that effectively communicated complex ideas and concepts to a wide range of audiences.

Other works
